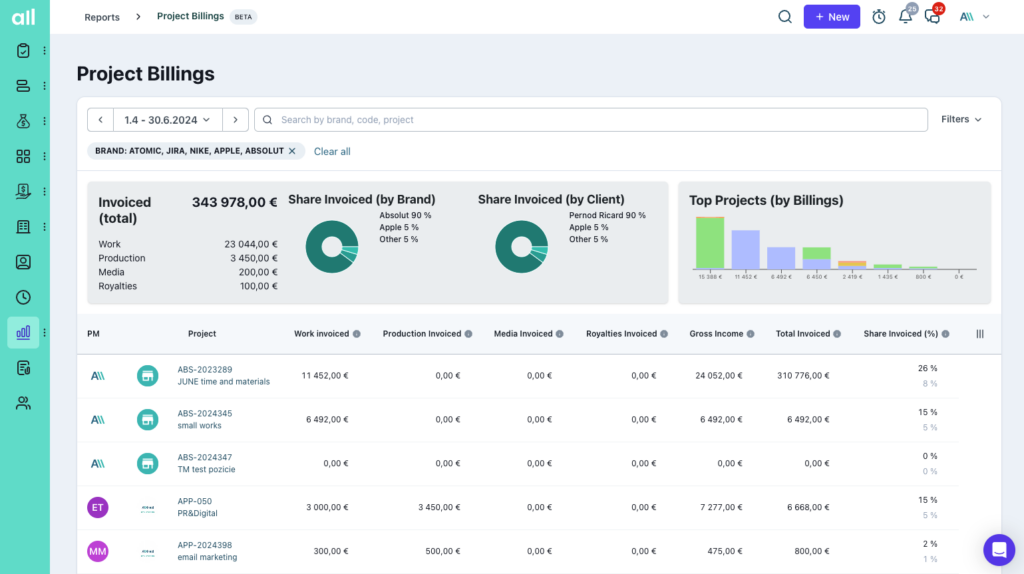
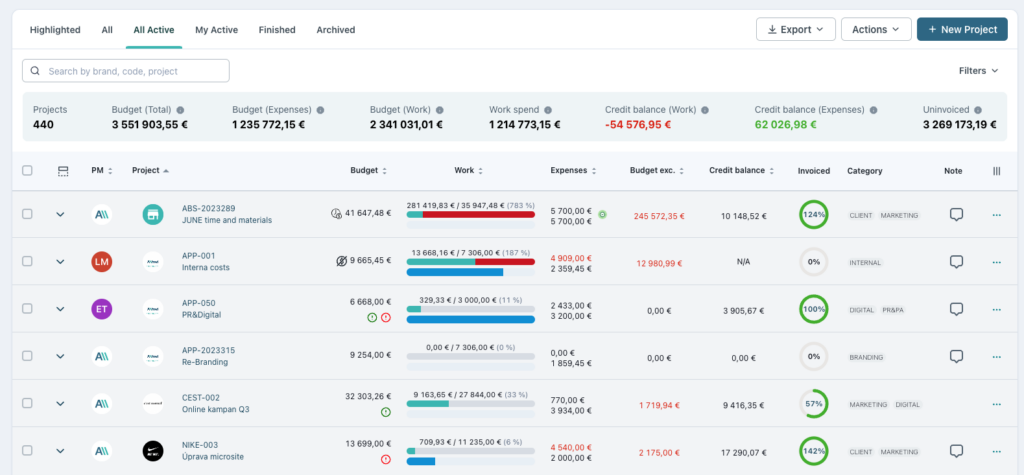
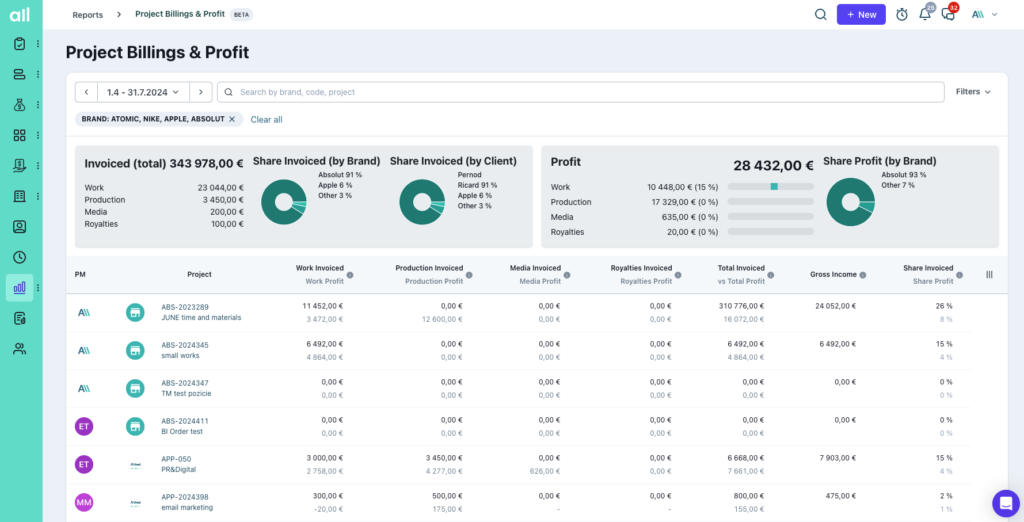
Revenue for each marketing agency is like fuel for a car. It powers the engine, propels the vehicle forward, and, when it’s high-quality, ensures a smooth and efficient ride. But to keep the car running smoothly and avoid breakdowns, you need to know the quality and composition of your fuel. That’s where revenue analysis becomes essential. The agency leads especially need to have an overview of their projects’ profitability in order to gain insights into the agency’s profits.
Table of Contents
📊 Understanding revenue analysis
Revenue analysis allows you to gain a deep understanding of how your agency’s revenue is being generated – meaning, it breaks down the composition of your revenue into each individual source, such as paid search, organic search, website visits, and more to allow you to identify which are the most profitable channels for your business.
4 Types of Revenue Analysis
#1 Trend analysis 🔥
Trend analysis is like a time machine for your revenue. It takes you back, showing how your earnings have changed over set periods – monthly, quarterly, or annually. Spotting patterns becomes a breeze, helping you predict future earnings and understand your brand seasonality.
#2 Product or service analysis 🤓
Think of this as a spotlight on your offerings. It shines a light on the revenue each product or service pulls in. You’ll see your star performers and those that might need a bit more stage presence. With this knowledge, you can fine-tune your product development and marketing strategies.
#3 Customer analysis 👩🏼💻
Here, you’re putting your customers center stage. Segment them – by industry (fmcg, automotive, fintech, etc.), client size, type of remuneration (retainer, project base) – then analyze the revenue each segment generates. This analysis allows you to get a clear picture of who your VIP customers are ; whether you
#4 Channel analysis 🗂️
This is your backstage pass to your sales channels. The main Department of Revenue. It shows you the revenue coming in from different sources – personal contact, lead nurturing, content marketing, etc. With this insight, you can tweak your sales strategy and allocate resources where they’ll make the most impact.
Key components of product revenue analysis
Let’s break down revenue analysis into smaller pieces.
🔵 Revenue streams identification
Identifying revenue stream means figuring out all the ways a business makes money. A business can make money through product sales, service fees, subscriptions, or even ads. A business can determine necessary improvements by identifying profitable streams versus unprofitable ones.
Example: A creative or marketing agency might identify its revenue streams as service fees from SEO optimization, social media management, content creation, ad placement, and media/external costs (also revenue commission from projects/campaigns).
🔵 Pricing strategy evaluation
Evaluating pricing strategy involves assessing whether a business pricing is optimal for maximizing revenue. When determining pricing, remember to consider factors like production costs, market demand, competitor pricing, and how much your customers are willing to pay. Offering tiered solutions can be an excellent strategy to scale your marketing agency while providing your clients with more value for their money.
Example: Agencies in the creative sector might evaluate their pricing strategy by comparing their prices with competitors, assessing the value customers place on their services, and considering their development and growth costs.
🔵 Customer segmentation and revenue
Customer segmentation involves dividing a business customer base into distinct groups based on characteristics like age, buying habits, demographics, sales data, product category, income level, or geographic location. Analyzing average revenue per each of these segments, a business can understand which types of customers are most profitable and tailor its marketing efforts accordingly.
Example: A PPC agency might segment its customers by age group and find that customers in the 25-34 age range generate the most revenue, prompting a focus on marketing efforts towards this demographic.
🔵 Revenue trends and patterns
Such an analysis report can provide valuable insights into a business financial health and growth potential. This includes looking at seasonal fluctuations, or changes in revenue following marketing campaigns, cyclical ad spend trends, or even product launches.
Example: An event marketing agency might analyze its revenue trends and find that sales increase significantly during the summer months, suggesting a potential opportunity to boost revenue further with summer-themed promotions or events.
Conducting effective sales revenue analysis
If you want to perform a revenue analysis effectively, you have to stick to a few essential steps.
Gather and organize relevant data
Kick off your sales revenue report by collecting and tidying up all the data you’ll need. Sales figures, client details, product info – you name it. Arrange it in a way that’s easy to sift through and make sense of.
💡 Allfred tip here! If you move your financial management to Allfred, all your important data will be easy to export in a few simple clicks. You can forget about preparing all the reports manually. The tool will take care of that for you.

Analyze revenue data
With your data neatly laid out, it’s time to dive in. Look for patterns – and anything that stands out. Maybe you’re selling more in certain months, or a particular customer group is bringing in the big bucks. Your mission here is to unearth insights that could give your sales strategy a boost.
Interpret the results
You’ve crunched the numbers, now what do they mean? This is where you decode the trends and patterns you’ve found. Let’s say a specific product line is raking in most of your revenue – that’s a star player that could use some extra marketing love.
Implement changes based on analysis
Armed with your newfound insights, you can start tweaking your sales strategy. This could mean shining the spotlight on high-performing products and services, wooing new customer groups, or playing around with your pricing. The aim of the game is to squeeze out as much revenue as possible based on what your analysis has revealed.
Monitor and adjust strategy
But the work doesn’t stop there. Keep an eye on how your changes are affecting things and be ready to switch up your strategy if needed. This means staying on top of your data gathering, and being open to making more changes based on what you find. This way, your sales strategy stays sharp and ready to roll with the punches.
💡 Allfred tip here! Get notified as soon as the expenses exceed the budget threshold, so that you can make adjustments or stop any further spending. On Allfred dashboard you can easily keep track of finances and see the balance clearly.

Common pitfalls in overall revenue projection (the dos and don’ts)
When it comes to projecting overall revenue, there are some common difficulties that can lead to less-than-accurate estimates. See how to avoid them.
🔴 Don’t ignore small revenue streams
It’s easy to focus on the big fish and forget about the smaller revenue streams. However, these can add up and sometimes even reveal new opportunities for growth. So, don’t disregard them. Keep an eye on all your revenue streams, big or small, and conduct revenue analysis whenever you feel like it. Yes, it takes time. Yes, it’s time-consuming. But it’s crucial for your cash flow!
It’s important to visualize your data too. Utilize bar charts and tables to better understand the customer’s information you’re collecting. Visualization will help you find patterns, identify and uncover gaps in your strategy to drive new sales. And that’s what all finance teams wish for, right?
💡 Allfred tip here! The Allfred dashboard was designed to make finance teams’ jobs easier. A clearly visualized data set allows you to spot important things faster. What’s more, it provides features that allow you to track each task and the time spent on it – so that you can allocate human resources more efficiently.

🔴 Do observe seasonal revenue fluctuations
Revenue can fluctuate with the seasons, and failing to account for this can skew your reports. Remember to factor in seasonal trends when analyzing your revenue to get a more accurate picture of your business’s performance or underlying sales. Your finance department should remember about it as well, as it might turn out that based on the data from previous years, you might want to sell better at different times or offer discount options to perform in the future.
Different time periods, like Christmas, might be better for sales and marketing of multiple products driving less revenue in other parts of the year. Monitoring your revenue by season can give you insight into what type of sales strategies are working or not working and if it’s better to focus on certain products and services in a given period – to boost a number of units sold (products purchased) in your business model.
🔴 Do regular updates on how your business is performing
Customer revenue analysis isn’t a one-and-done deal. It needs to be updated regularly to stay relevant. Make it a habit to update your income-generated data to keep up with changes in your business and the market, and make accurate major changes in your future marketing strategies if needed.
Update the data not only for yourself but also for your staff – to recognize top performers and make informed decisions for your team’s growth and direct feedback.
💡 Allfred tip here! Allfred automatically updates the data for you. Using the revenue analysis dashboard, you can watch how the data changes over time-based on the performance of a project, the number of hours tracked and sold, etc.
🔴 Don’t rely solely on historical data
While data you already have is a valuable resource, it shouldn’t be the only factor considered. Current market trends, customer behavior, and competitive landscape can significantly impact your total revenue and should be included in your reporting.
For example, if an average price increase is implemented, the historical data might not adequately reflect that. Therefore, always factor in any changes when comparing current and past performance metrics in your projection.
🔴 Consider the cost of revenue
Focusing solely on revenue without considering the costs associated with generating that revenue can lead to an inaccurate understanding of your business’s profitability. Always consider the cost of services sold, operating expenses, and other costs in your report.
Taking the initiative to incorporate all the necessary data and metrics can ultimately help you make more informed business decisions. The insights derived should provide your organization with the confidence to invest in the right areas and better prediction.
Allfred: Your Agency’s Secret Weapon to Analyze Revenue and Forecast 🚀
Allfred is a workflow platform designed to automate and transform your advertising agency into a well-oiled machine. It’s a single environment that guides everyone through the ideal process, from budgeting and resource planning to project management and final invoicing.

But how does it fit into rev optimization? Let’s dive in!
Real-Time decision-making 🕒
Allfred integrates all agency data, enabling real-time decision making. This feature is crucial for product revenue analytics as it allows you to monitor your revenue streams as they happen, and make immediate adjustments if necessary.
Laser precision and X-Ray vision 🔍
The platform provides a detailed view of your company’s financial performance. With Allfred, you can see your revenue generated with laser precision. It’s like having a superpower that lets you see the financial health of your agency in real-time – without Excel spreadsheets.

Never lose a penny again 💰
Allfred is designed to ensure that every penny is accounted for. The platform makes it easy to forecast, report, and invoice all projects, reducing the chances of financial leakage and generating more revenue in decisions. Also, its dashboard is designed in such a way to make tracking and spotting easier. Thanks to that, you will keep the fingers on the pulse, always.
Team planning and project management 📝
Allfred isn’t just about numbers, it’s also about people. The platform offers features for team planning and project management, which indirectly contribute to revenue optimization. Ensuring that your team functions effectively and projects are finished within the allotted time frame guarantees a seamless flow of revenue.
Tailored for advertising, digital, and PR agencies 🎯
What sets Allfred apart is that it’s 100% tailored for advertising, digital, or PR agencies. Unlike some i.e ERP solutions, understands the unique challenges and needs of these industries, making it a powerful tool for agencies.
Calculate and boost your business revenue
When it comes to revenue analytics, you need to take into account a broad range of factors, from your client’s customer journey to your own KPIs. With Allfred, you can easily get an overview of these metrics and identify opportunities for improvement. How about checking it out, yourself, in your own agency? Take a look at Allfred in action and schedule a demo.


